> ## Documentation Index
> Fetch the complete documentation index at: https://docs.plerion.com/llms.txt
> Use this file to discover all available pages before exploring further.
# Findings
> Understand, filter, download, and exempt findings in Plerion to manage risks across your cloud environments.
With **Findings**, you can track security issues detected in your cloud environments, prioritize them by severity, and manage exemptions when necessary.
## Severity levels
Plerion assigns severity levels to findings so you can prioritize based on potential impact:
* **Critical**\
Immediate and significant threats, often exploitable. Require urgent attention and remediation.
* **High**\
Severe risks that could lead to major impact. Require prompt action.
* **Medium**\
Issues with moderate impact. Should be remediated within a reasonable timeframe.
* **Low**\
Minimal impact or unlikely to be exploited. Still recommended to resolve.
* **Informational**\
Observations or best practices that do not represent actual security vulnerabilities, but can still help improve your security posture.
***
## Findings dashboard
The [Findings dashboard](https://app.plerion.com/findings) provides a centralized view of all misconfigurations and other issues detected across your cloud environments, helping you quickly assess, investigate, and remediate issues from one place.
### Metrics
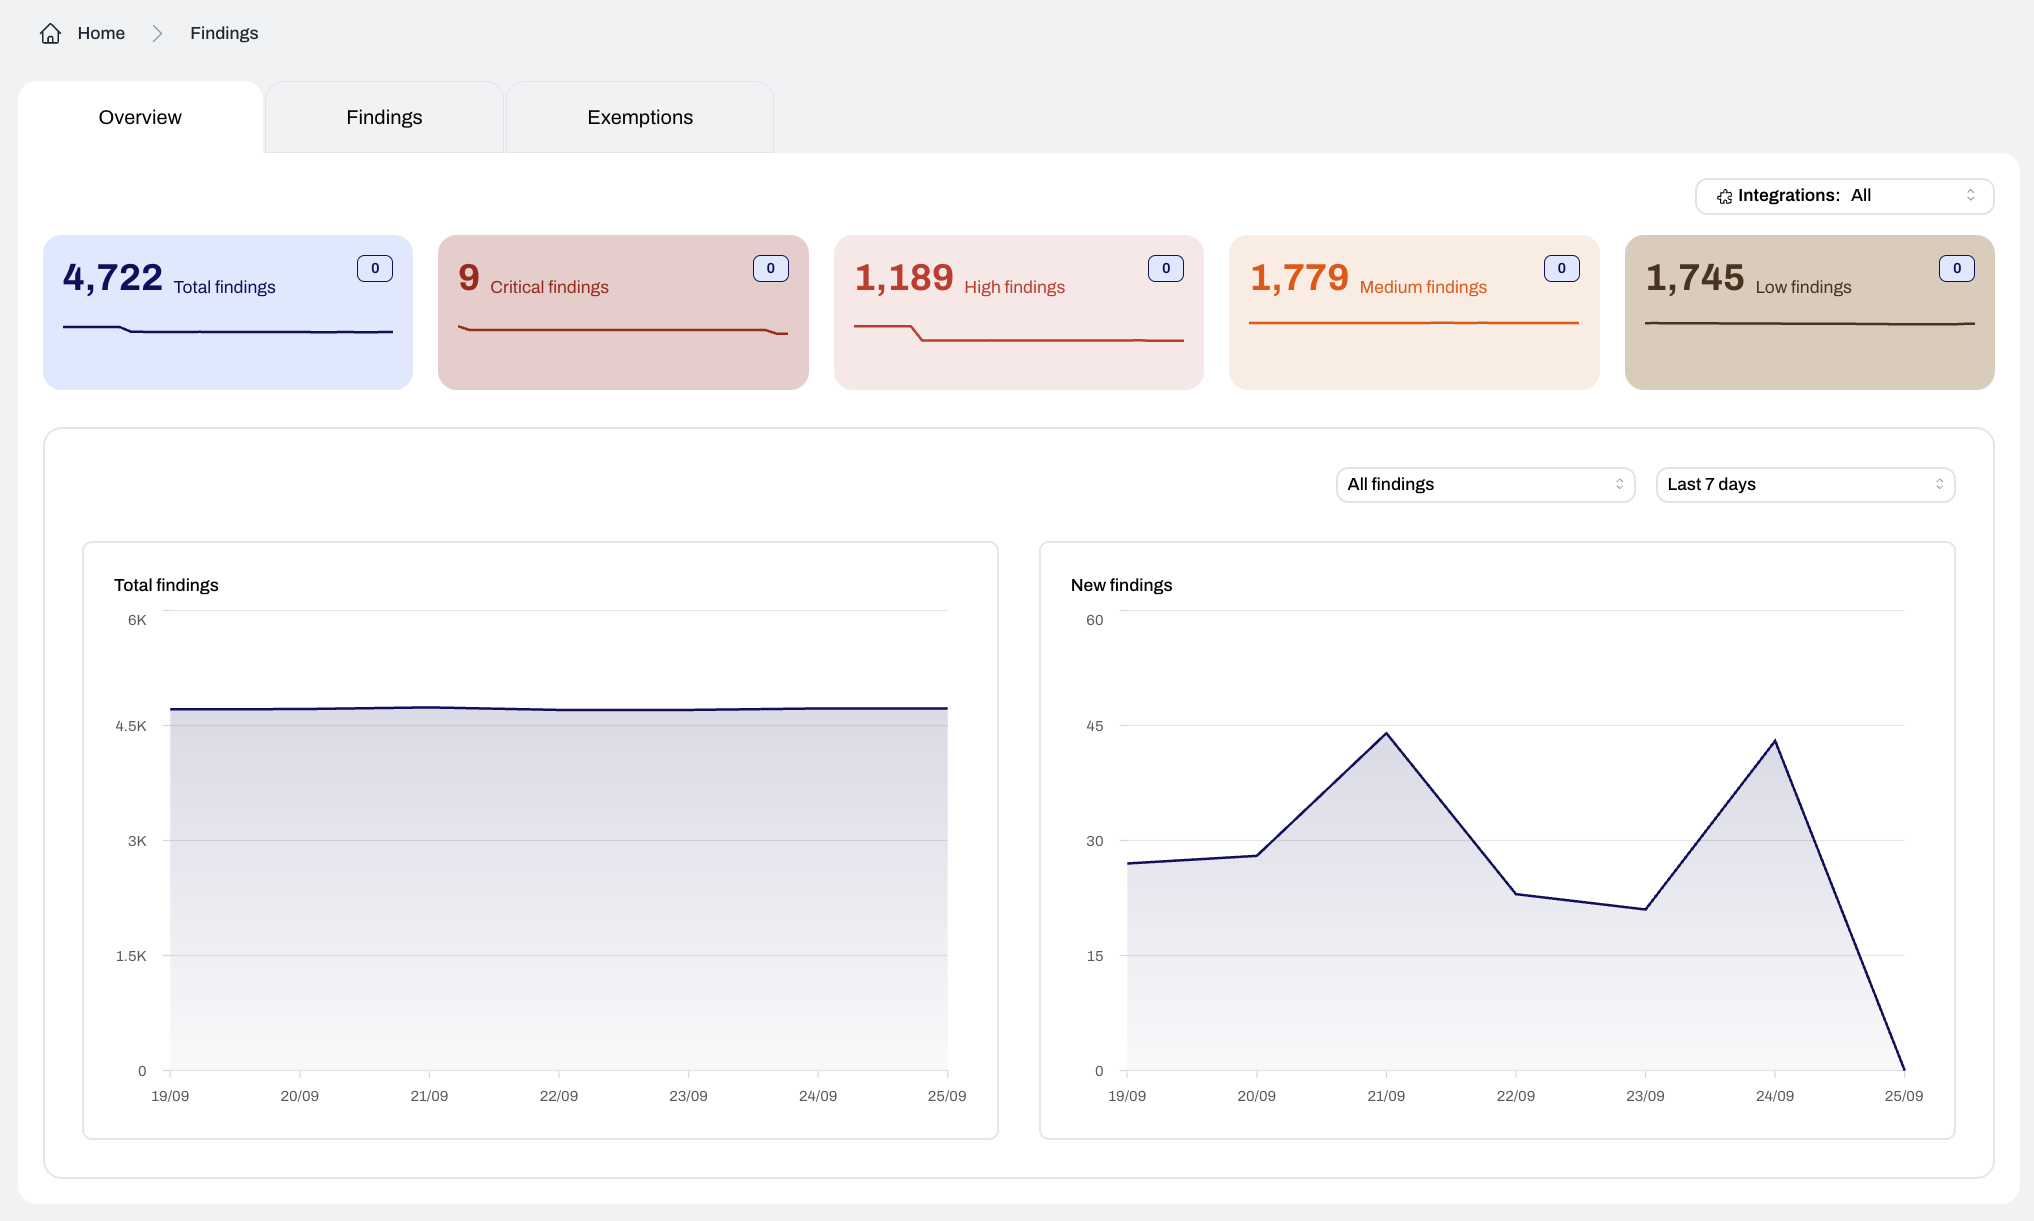
The **Metrics** view summarizes key data points so you can monitor findings at a high level:
* Total number of findings
* Counts of Critical, High, Medium, and Low findings
* Trend of total findings over time
* Trend of new findings detected
You can filter these metrics by **integration** and by **time period** (last 7 days, 30 days, past quarter, or past annum).
 ### Grouping
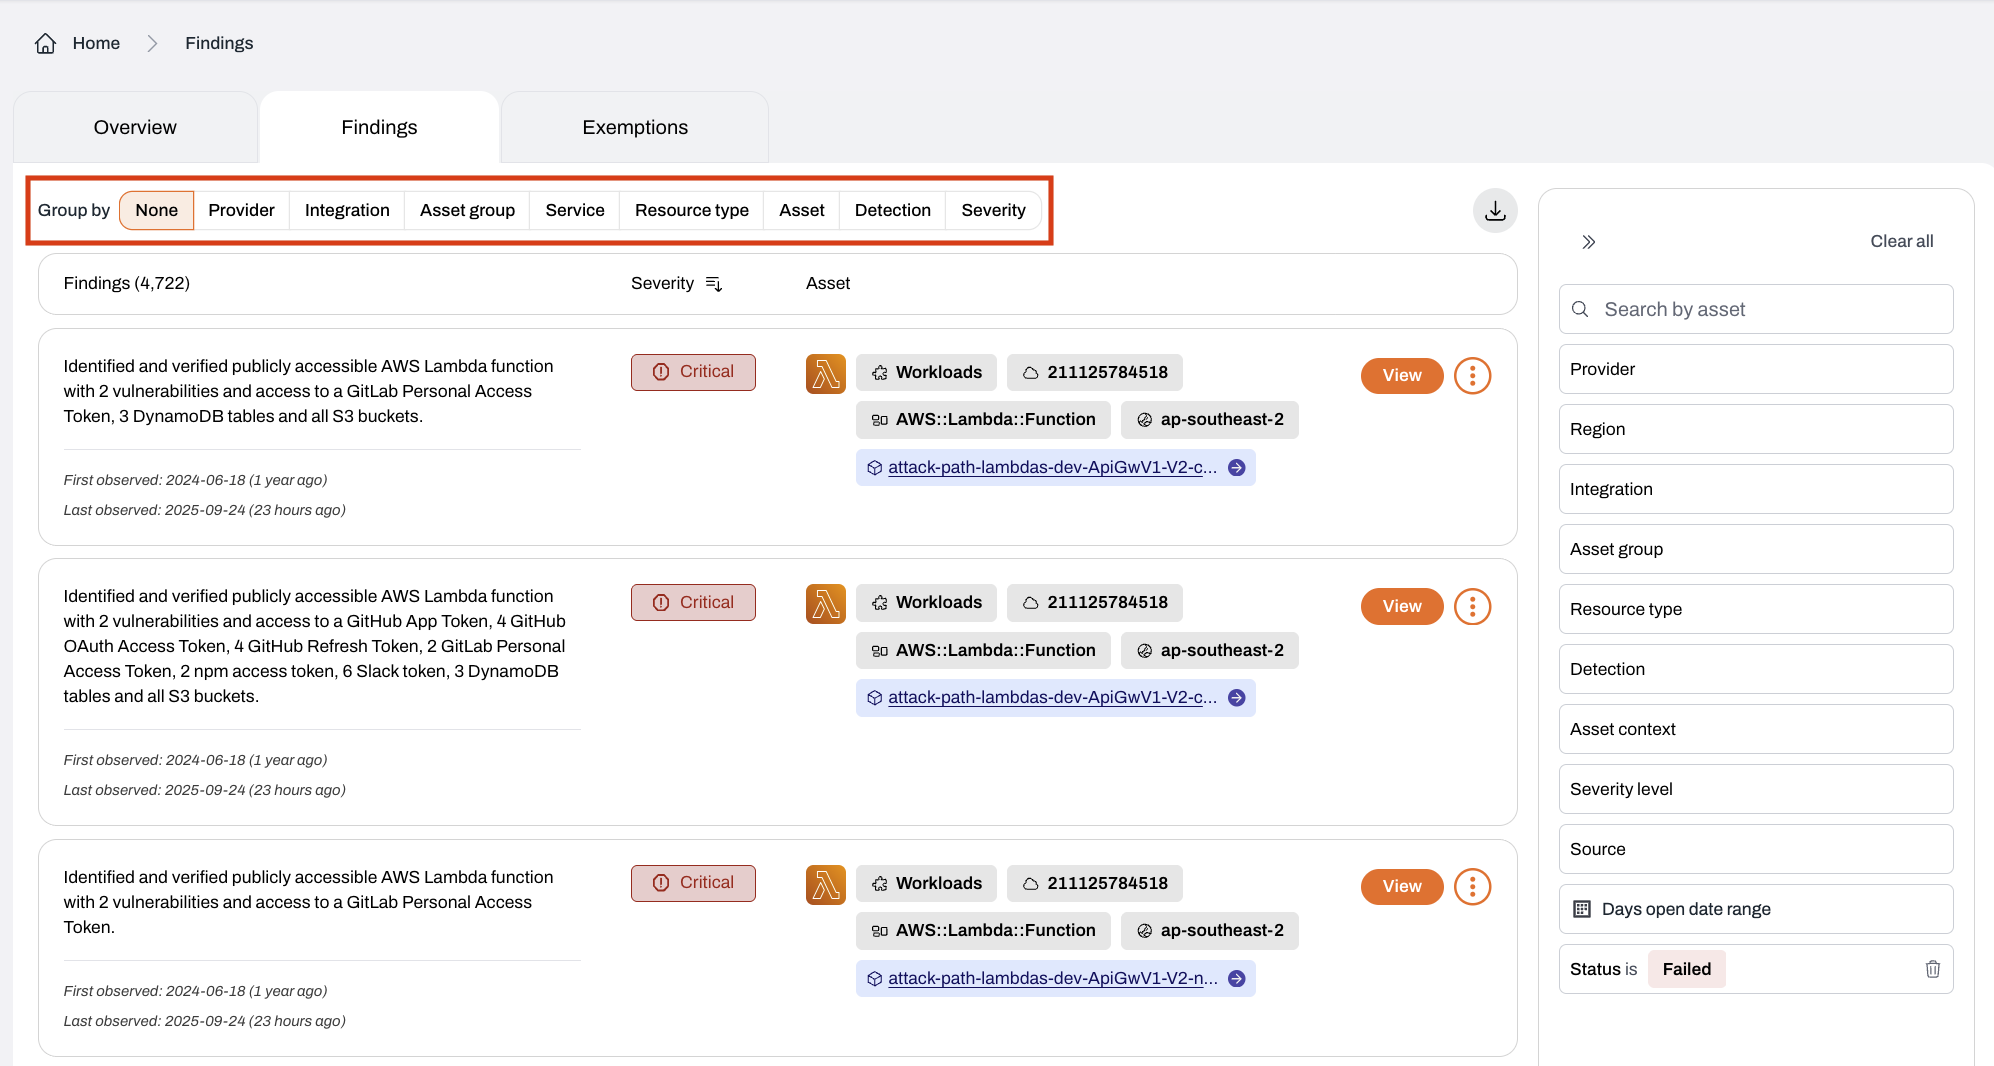
You can group findings by **Provider**, **Integration**, **Asset group**, **Service**, **Resource type**, **Asset**, **Detection**, or **Severity**.
### Grouping
You can group findings by **Provider**, **Integration**, **Asset group**, **Service**, **Resource type**, **Asset**, **Detection**, or **Severity**.
 ### Filtering
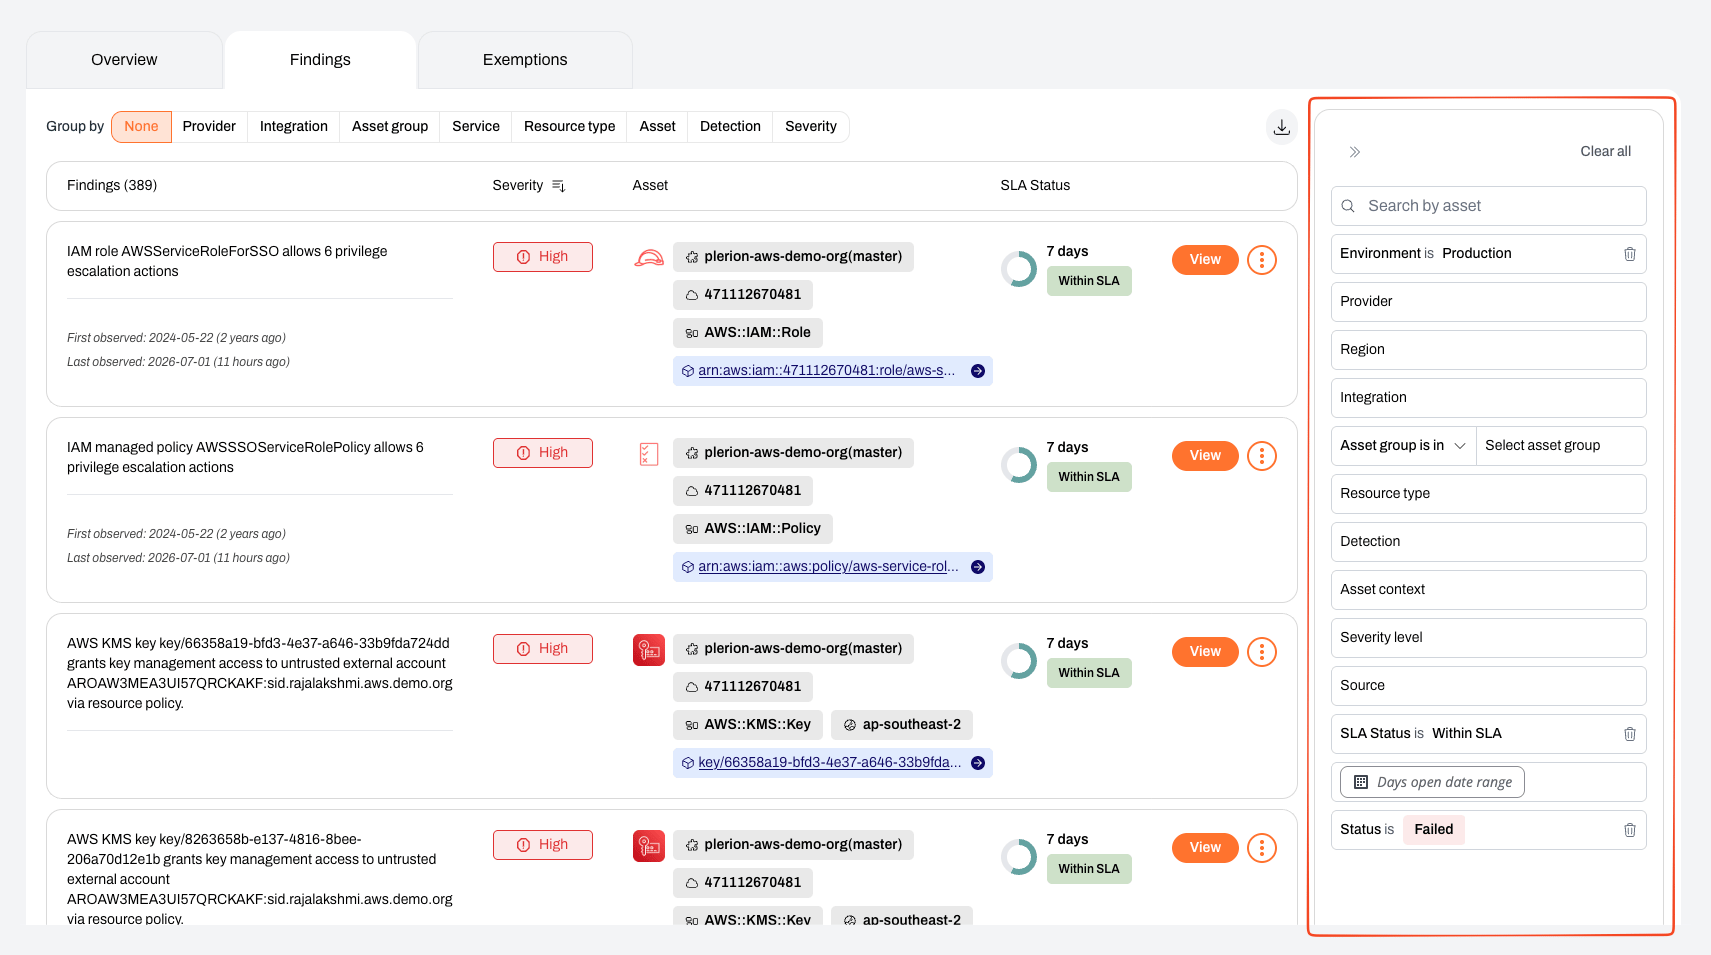
Apply filters to narrow results by:
* **Provider**: AWS, Azure, GCP, or Kubernetes
* **Region**: Cloud provider regions
* **Integration**: Your connected cloud environments
* **Asset group**: Asset groups you have created
* **Resource type**: Cloud resource types (e.g. S3 buckets)
* **Detection**: Plerion-specific detections
* **Asset context**: e.g. publicly exposed, no access logging, no encryption in transit
* **Severity level**: Critical, High, Medium, Low
* **Source**: Amazon GuardDuty, Amazon Macie, AWS CloudTrail, AWS IAM Access Analyzer, or Plerion
* **Days open**: Filter by when the finding was first observed
* **Status**: Passed or Failed
* **SLA status**: Within SLA, nearing breach, or breached (failed findings tracked against an SLA)
### Filtering
Apply filters to narrow results by:
* **Provider**: AWS, Azure, GCP, or Kubernetes
* **Region**: Cloud provider regions
* **Integration**: Your connected cloud environments
* **Asset group**: Asset groups you have created
* **Resource type**: Cloud resource types (e.g. S3 buckets)
* **Detection**: Plerion-specific detections
* **Asset context**: e.g. publicly exposed, no access logging, no encryption in transit
* **Severity level**: Critical, High, Medium, Low
* **Source**: Amazon GuardDuty, Amazon Macie, AWS CloudTrail, AWS IAM Access Analyzer, or Plerion
* **Days open**: Filter by when the finding was first observed
* **Status**: Passed or Failed
* **SLA status**: Within SLA, nearing breach, or breached (failed findings tracked against an SLA)
 ### Download
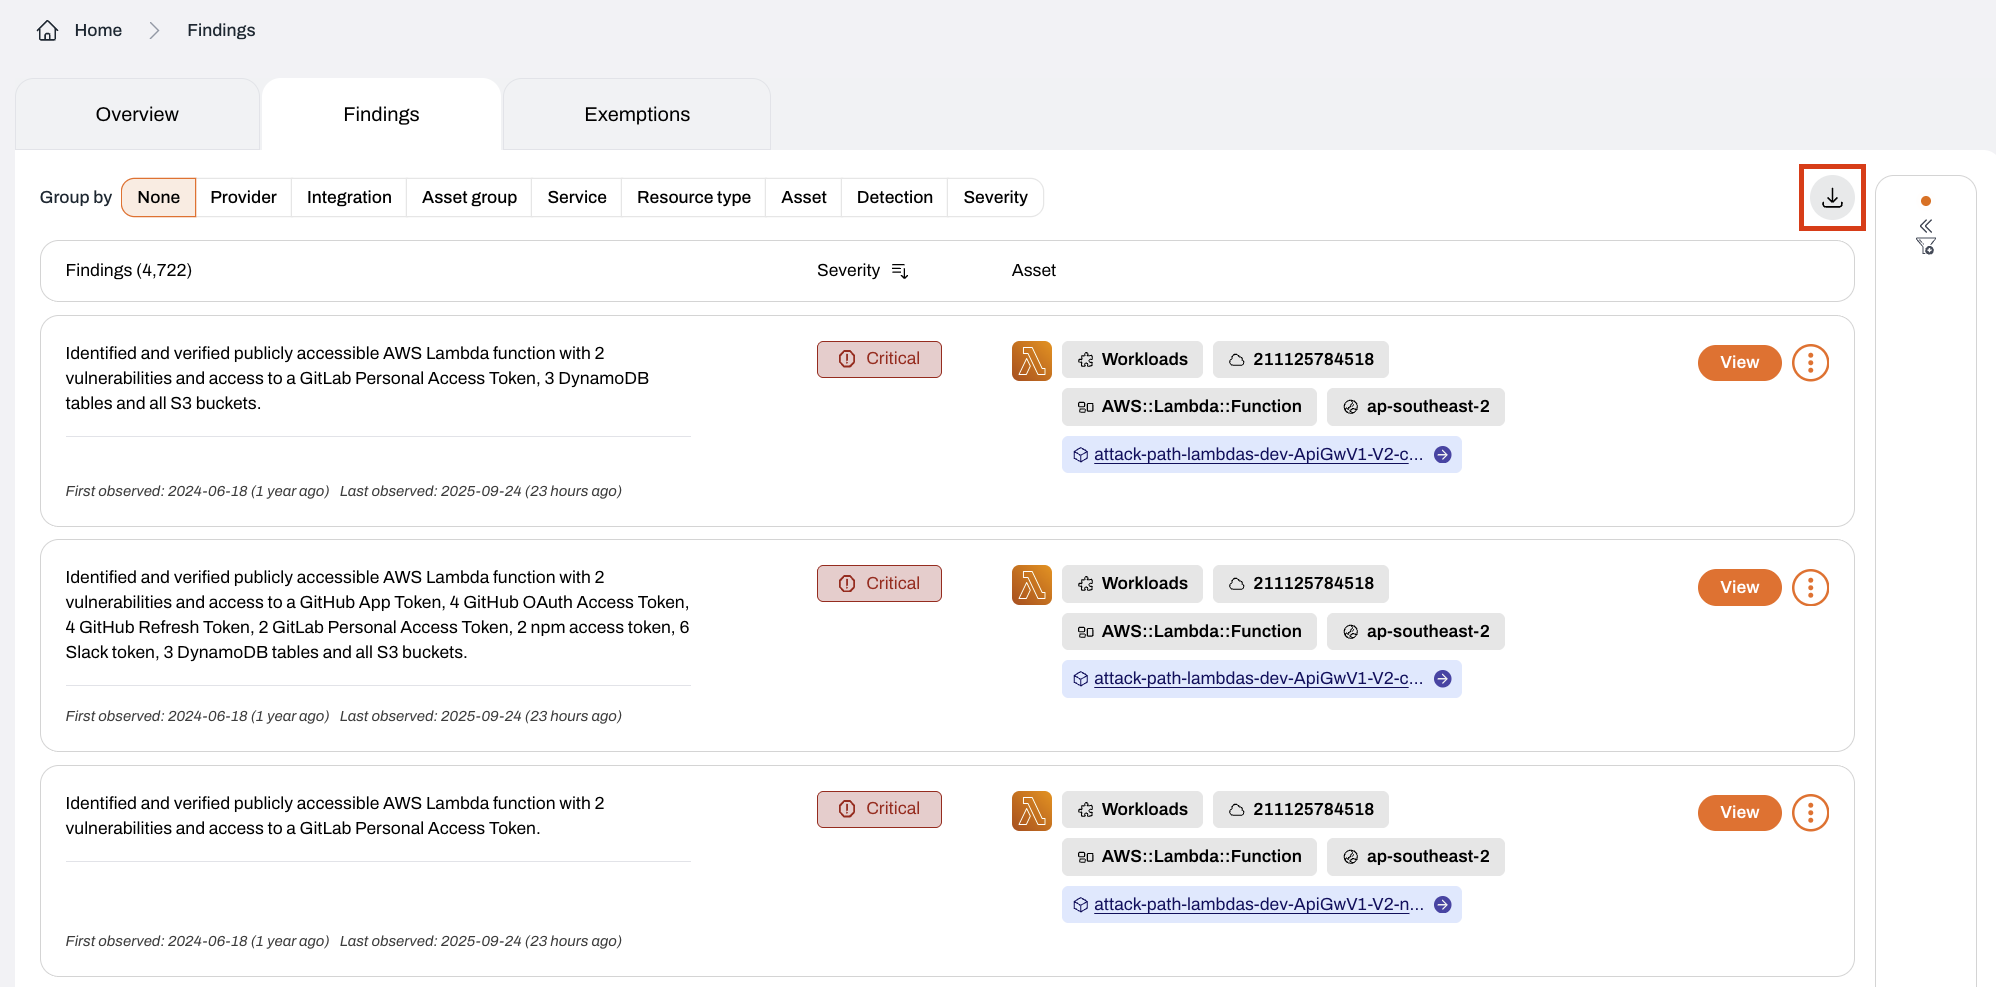
Click the download icon to export findings from the dashboard as a CSV file.\
Each export includes up to **5,000 rows**.
### Download
Click the download icon to export findings from the dashboard as a CSV file.\
Each export includes up to **5,000 rows**.
 ### API access
Use the [Public API](/api-reference/) for programmatic access to all findings.
***
## Finding details
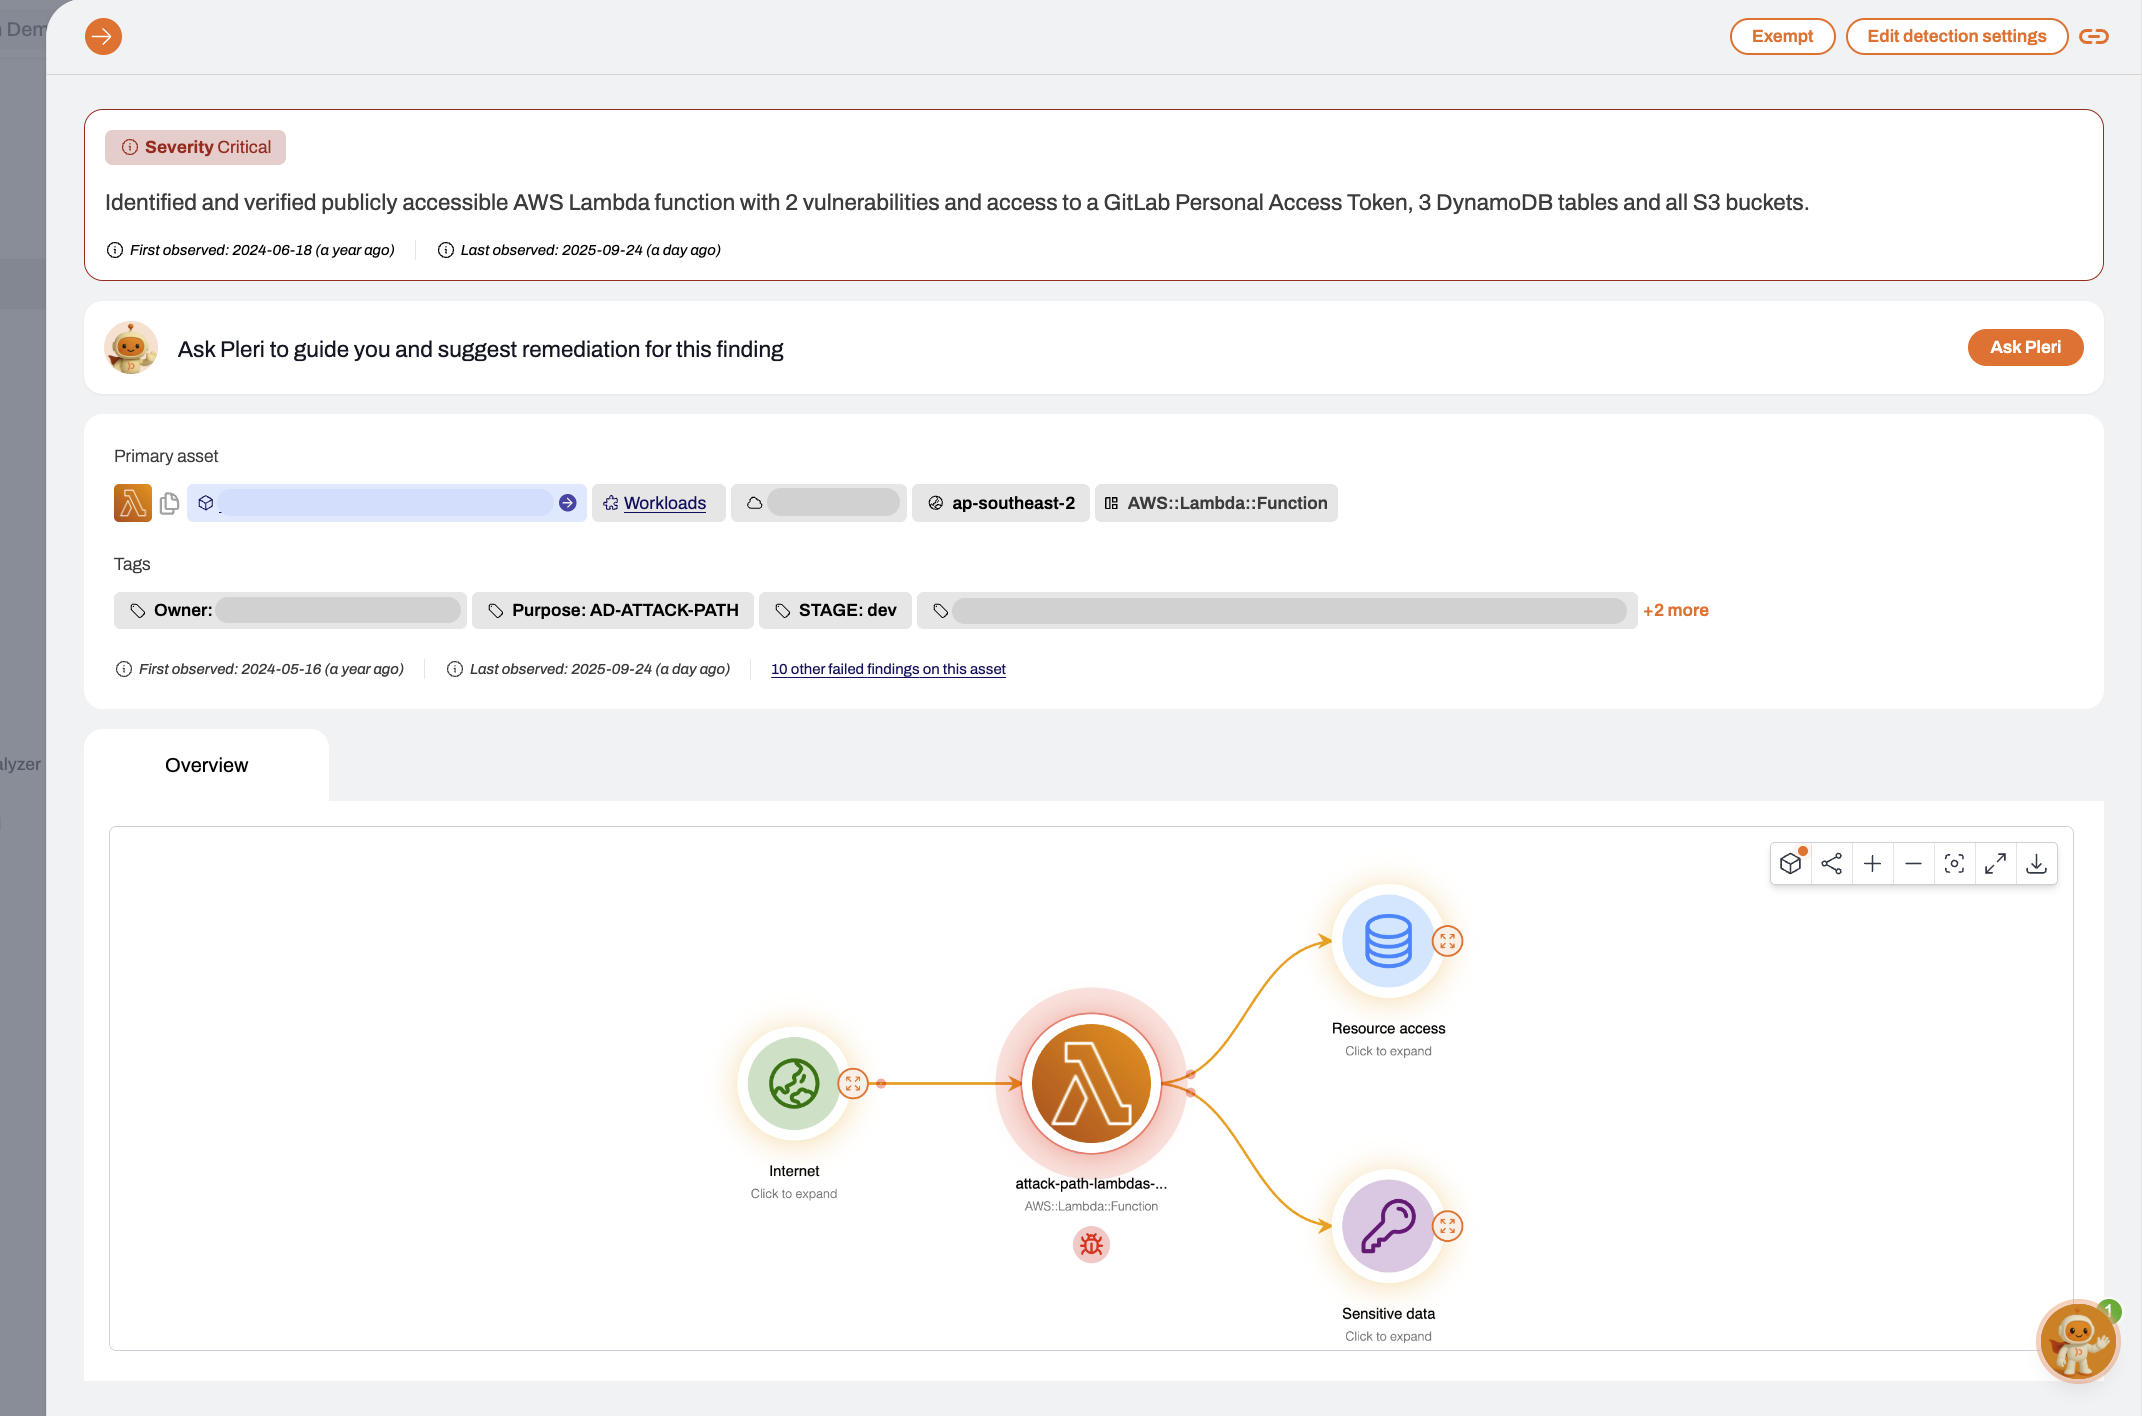
Click a finding to open a detailed view with full context and guidance:
* **Finding summary**\
Shows the description, severity level, and when the finding was first and last observed.
* **Remediation guidance with Pleri**\
Step-by-step guidance and automated suggestions to help resolve the issue.
* **Primary asset**\
The affected resource, with details such as the provider account ID, region and asset type.
* **Tags**\
Metadata such as owner, purpose, or environment.
* **Attack path** *(if applicable)*\
An interactive visualization showing how a threat actor could move through your environment.
### API access
Use the [Public API](/api-reference/) for programmatic access to all findings.
***
## Finding details
Click a finding to open a detailed view with full context and guidance:
* **Finding summary**\
Shows the description, severity level, and when the finding was first and last observed.
* **Remediation guidance with Pleri**\
Step-by-step guidance and automated suggestions to help resolve the issue.
* **Primary asset**\
The affected resource, with details such as the provider account ID, region and asset type.
* **Tags**\
Metadata such as owner, purpose, or environment.
* **Attack path** *(if applicable)*\
An interactive visualization showing how a threat actor could move through your environment.
 ***
## SLA status
Plerion tracks resolution deadlines for failed findings against the service-level agreements (SLAs) configured for your tenant. When a matching SLA applies, each failed finding shows its SLA status in the findings list and on the finding detail page, along with the time remaining until its deadline.
* **Within SLA**\
The finding is tracked and still ahead of its warning window.
* **Nearing breach**\
The finding has entered its warning window but has not yet passed its resolution deadline.
* **Breached**\
The resolution deadline has passed and the finding is still open.
SLA status applies only to failed findings that match an SLA configured for your tenant. Configure finding resolution SLAs in your [tenant settings](https://app.plerion.com/settings/sla).
***
## Exempting findings
You can exempt findings that are false positives, acceptable risks, or mitigated by other controls.
Risk scores will update after the next scheduled scan. If exempted findings still appear in **Top assets at risk**, wait for the next scheduled scan or trigger a manual one under `Settings` > `Integrations` > `Scan now` button.
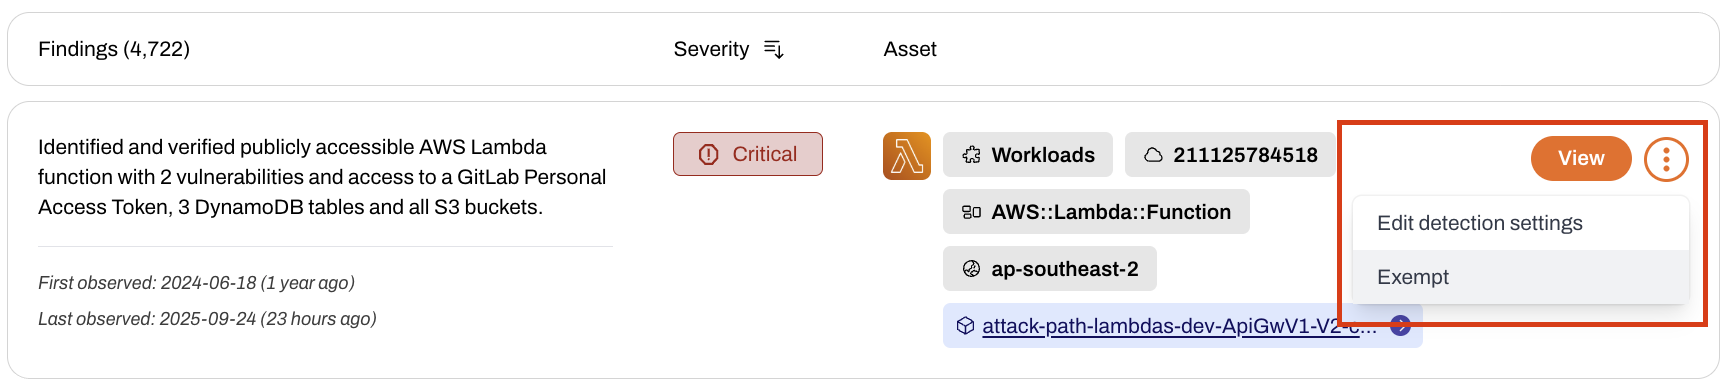
Click the kebab menu (`⋮`) on a widget and click `Exempt`.
***
## SLA status
Plerion tracks resolution deadlines for failed findings against the service-level agreements (SLAs) configured for your tenant. When a matching SLA applies, each failed finding shows its SLA status in the findings list and on the finding detail page, along with the time remaining until its deadline.
* **Within SLA**\
The finding is tracked and still ahead of its warning window.
* **Nearing breach**\
The finding has entered its warning window but has not yet passed its resolution deadline.
* **Breached**\
The resolution deadline has passed and the finding is still open.
SLA status applies only to failed findings that match an SLA configured for your tenant. Configure finding resolution SLAs in your [tenant settings](https://app.plerion.com/settings/sla).
***
## Exempting findings
You can exempt findings that are false positives, acceptable risks, or mitigated by other controls.
Risk scores will update after the next scheduled scan. If exempted findings still appear in **Top assets at risk**, wait for the next scheduled scan or trigger a manual one under `Settings` > `Integrations` > `Scan now` button.
Click the kebab menu (`⋮`) on a widget and click `Exempt`.
 Provide the following mandatory information:
* **Exemption reason**: Accepted risk, false positive, or compensating control
* **Exempt by**: Name, region, or tags
* **Exempt by details**: Based on your **Exempt by** choice
* **Audit note**: A short explanation for audit purposes
Provide the following mandatory information:
* **Exemption reason**: Accepted risk, false positive, or compensating control
* **Exempt by**: Name, region, or tags
* **Exempt by details**: Based on your **Exempt by** choice
* **Audit note**: A short explanation for audit purposes
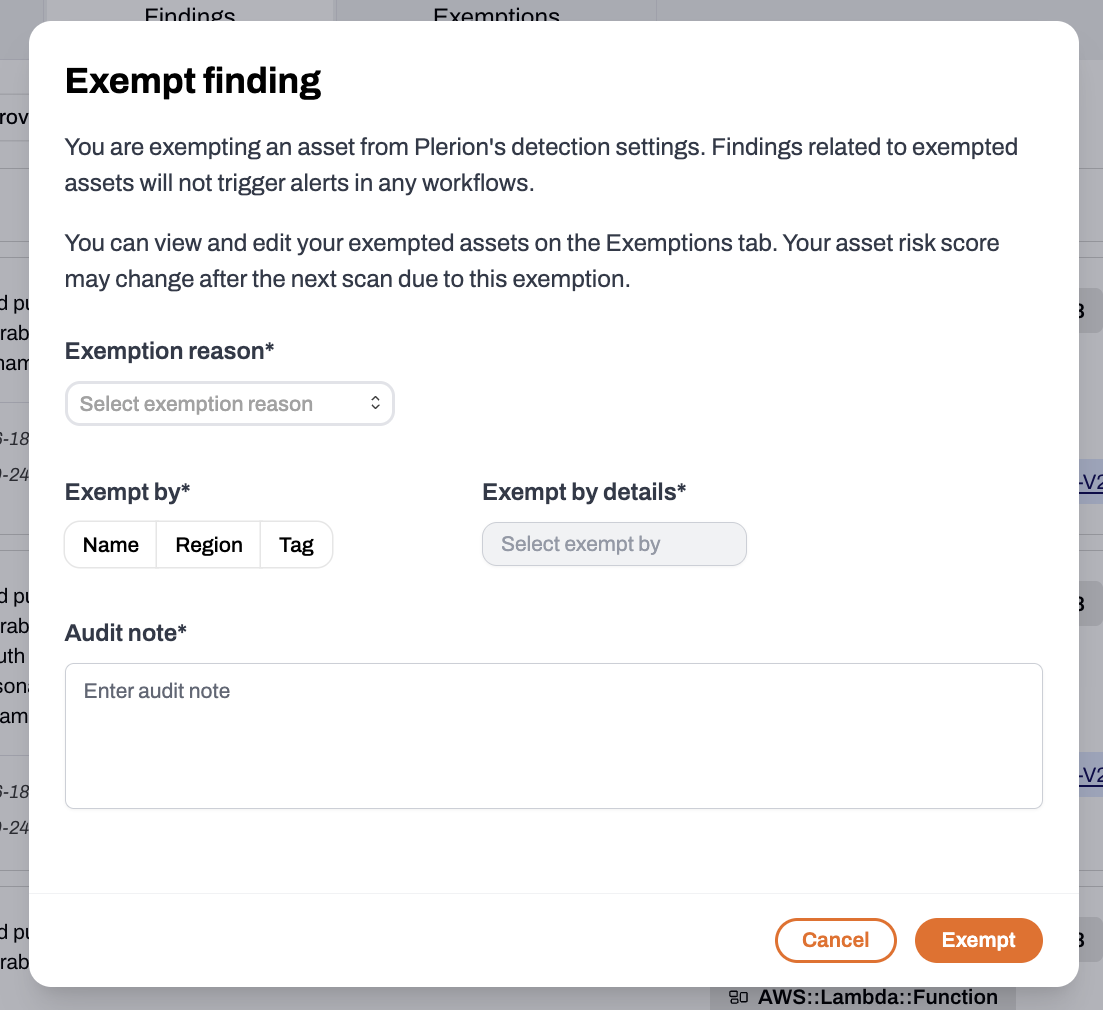 * Findings related to exempted assets will not trigger alerts in any workflows.
* Your asset risk score may change after the next scan due to this exemption.
* You can review and manage all exempted findings in the **Exemptions** tab.
* Findings related to exempted assets will not trigger alerts in any workflows.
* Your asset risk score may change after the next scan due to this exemption.
* You can review and manage all exempted findings in the **Exemptions** tab.