> ## Documentation Index
> Fetch the complete documentation index at: https://docs.plerion.com/llms.txt
> Use this file to discover all available pages before exploring further.
# Custom reports
> Use Plerion custom reports to design, manage, and schedule reports with flexible widgets that visualize findings, assets, vulnerabilities, and more.
With [Custom reports](https://app.plerion.com/settings/custom-reports), you can create interactive dashboards and scheduled reports, giving you control over how insights are visualized, filtered, and shared.
## Key features
* **Report creation**\
Build multiple reports in a dedicated report builder interface.
* **Report management**\
Update, edit, or delete reports at any time.
* **Report scheduling**\
Deliver reports automatically to your email on a set schedule.
* **PDF export**\
Download reports as PDF files for sharing and record-keeping.
* **Widget creation and management**\
Add, update, or remove widgets to customize each report, and choose from widget types such as counts, trends, charts, tables, lists, text, and risk scores. You can also start quickly with predefined templates like the Executive Report.
* **Dashboard customization**\
Move and arrange widgets to create flexible and organized layouts.
***
## Widget types
Widgets define how your data is displayed. Supported widget types include:
* **Chart:** Displays data as charts (currently bar charts only)
* **List:** Lists data in a simple format
* **Metric count:** Shows the total count of selected metrics
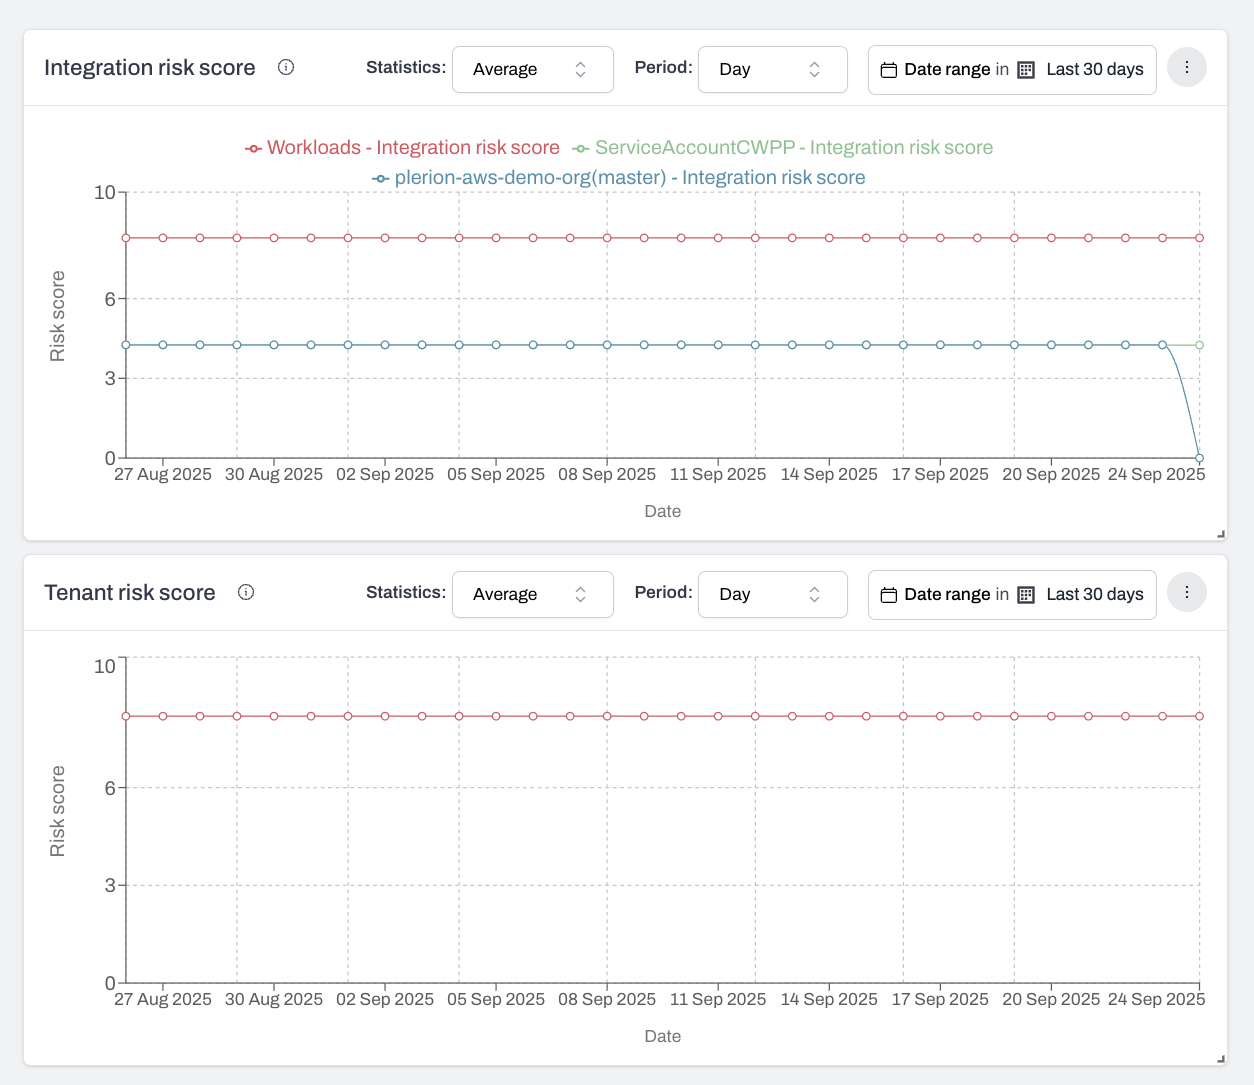
* **Metric trend:** Displays data trends over time in a line chart
* **Risk score:** Visualizes risk score data
* **Summary:** Provides a summarized view of selected data
* **Table:** Organizes data in a tabular format (currently supported for findings only)
* **Text:** Adds static text to your report
* **Top assets at risk:** Lists the assets with the highest risk score
* **Unit consumption:** Shows usage or consumption of units over time
Choose a widget type based on how you want to visualize your data.\
For example, selecting **Metric count** with a filter `Status: FAILED` will display the number of failed findings. Choosing **Metric trend** will display a line chart showing change over time.
***
## Data sources
Data sources define what information is available to your widgets. Supported data sources include:
* Alerts
* Assets
* Compliance
* Findings
* Risk score
* Tenant usage
* Top risks
* Vulnerabilities
The widget type you choose determines which data sources are available.\
For example, the **Table** widget currently only supports the **Findings** data source.
***
## Filters
Filters allow you to refine the data shown in each widget. Available filters depend on the widget type and data source.
For example, if you choose the **Metric trend** widget with the **Assets** data source, you can apply filters tailored to that combination.
See [How to create a custom report](/guides/platform/custom-reports/how-to-create-a-custom-report) for a step-by-step walkthrough.
***
## Integration-level vs tenant-level metrics
Metrics in Plerion can be scoped at either the integration level or the tenant level.
* **Integration-level metrics**
* Metrics such as asset count, findings, and vulnerabilities apply to a single integration.
* Use the **Integration** filter to view data from a specific integration.
* **Tenant-level metrics**
* Metrics such as compliance and overall risk score aggregate data from all integrations in your tenant.
* The **Integration** filter is hidden for these metrics because they are not tied to a single integration.
* For example, selecting an integration will not change tenant-level compliance results.
When you select **Tenant risk score**, the integration filter is hidden.\
If you select **Integration risk score**, the integration filter becomes available.